Highest overlap
Grant, Harney, Union, Coos, Douglas, and Klamath score high on both demographic fragility and public-goods viability risk.
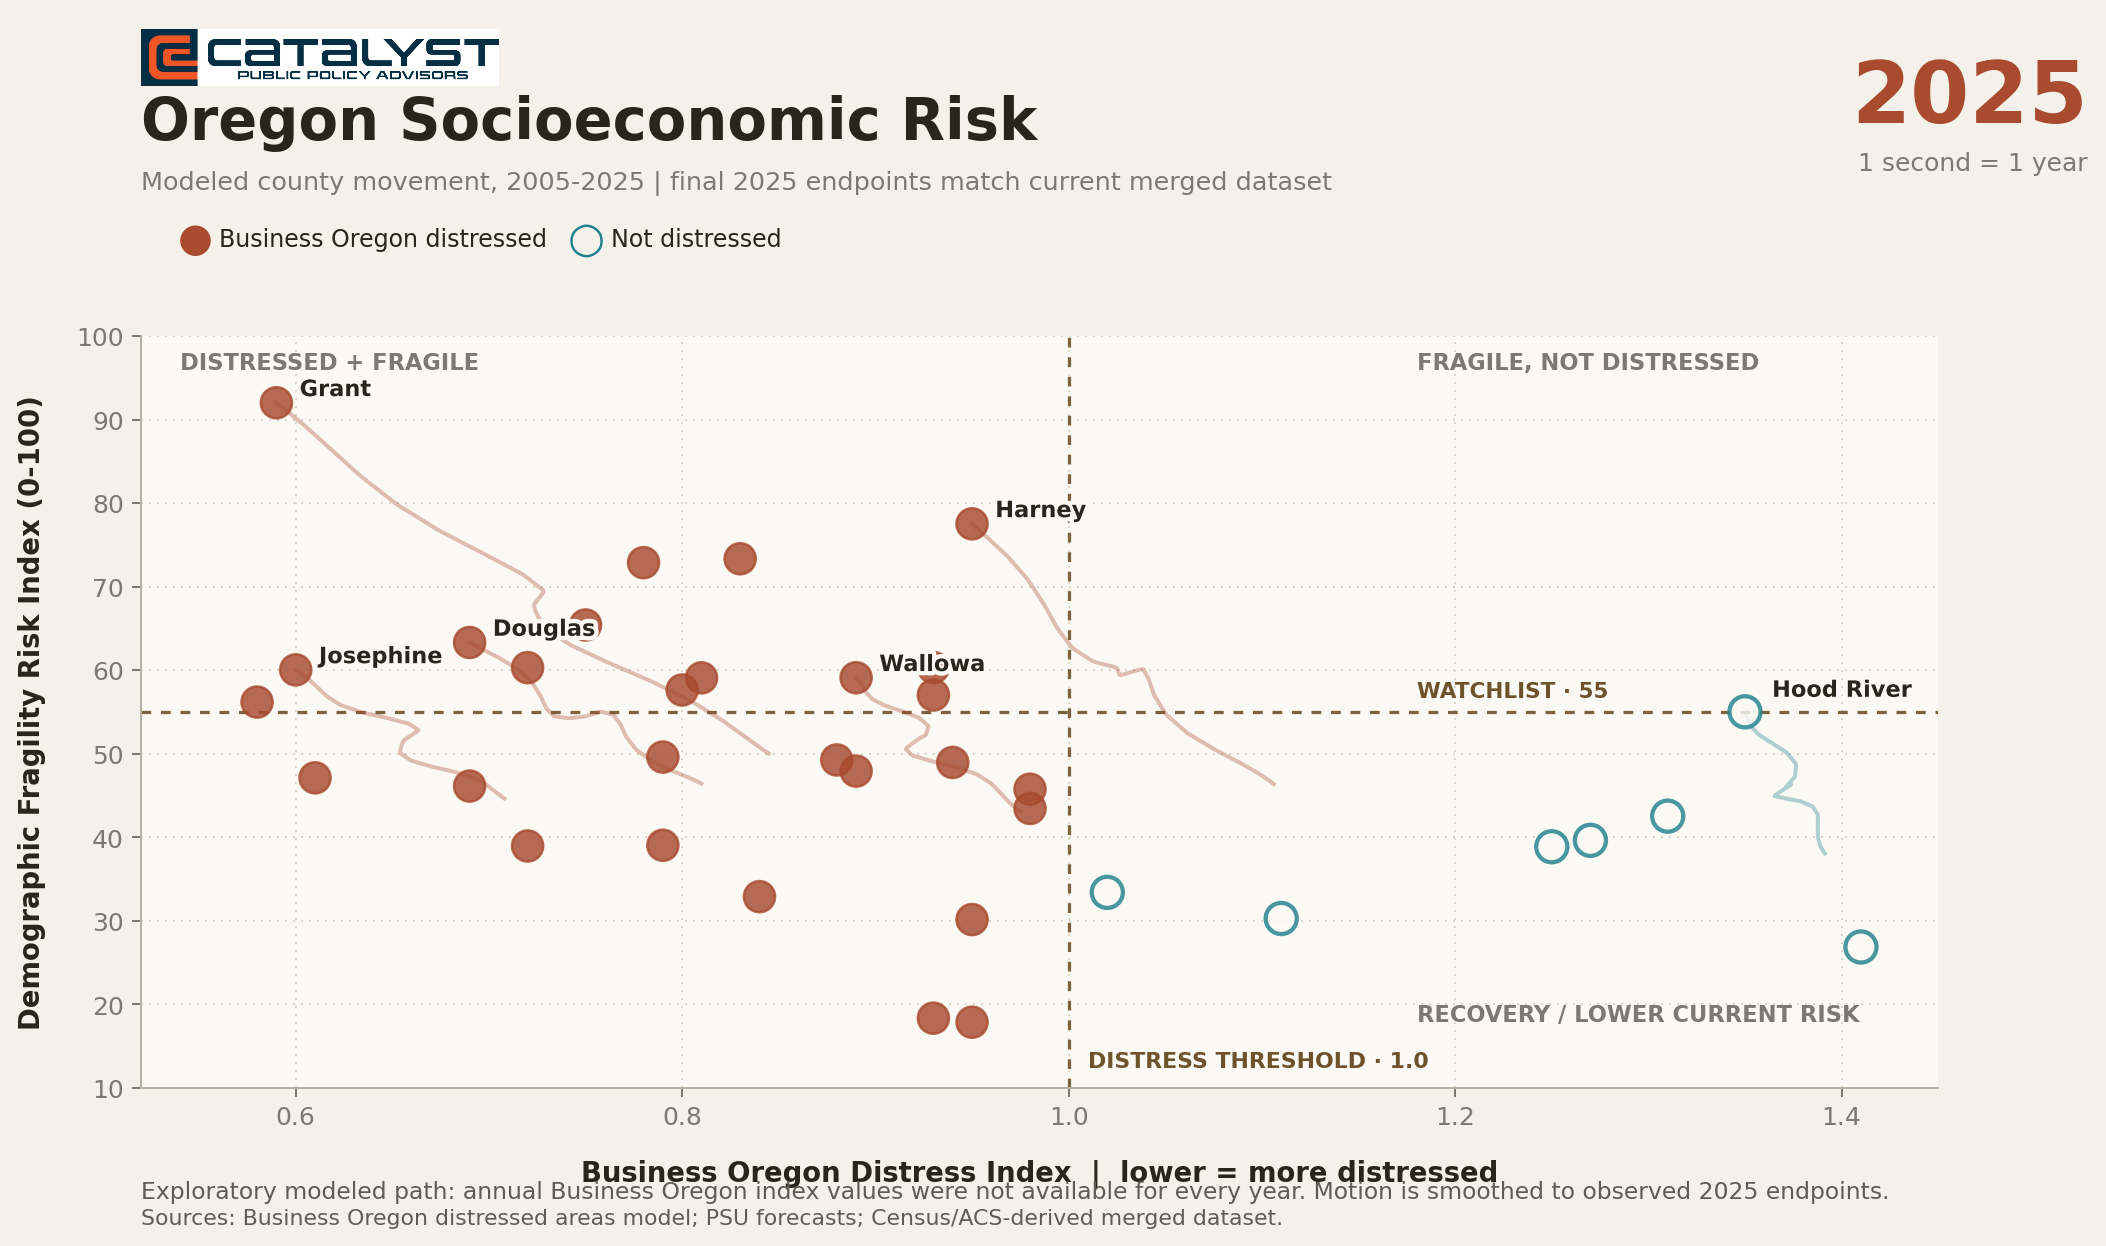
Draft exploratory screen
Policy screen · Oregon · 36 counties
An exploratory cross-check pairing Business Oregon's economic distress model with a broader demographic-fragility lens and a new public-goods viability subindex. Use it to surface counties whose long-run population picture, taxable-base capacity, and service-scale pressure rhyme with, or diverge from, the official distressed list.
Reading the chart. A county sitting to the left of the vertical line meets Business Oregon's distress cutoff (lower index = weaker economic indicators). A county sitting above the horizontal line crosses the demographic-watchlist threshold built from forecast decline, aging, tract-level change, and outside-UGB exposure. Counties in the upper-left quadrant register on both lenses; counties in the upper-right are demographically fragile even though they are not on the official distressed list.
Note: Multnomah appears in the dataset but is not plotted here — the demographic risk index is unavailable due to incomplete PSU forecast coverage at this county geography.
New layer
The public-goods viability subindex is a draft supplemental screen that asks whether counties have enough taxable base, fiscal yield, and population scale to sustain basic public goods while demographic pressures intensify. It is not a proposed replacement for Business Oregon's statutory distress model.
Grant, Harney, Union, Coos, Douglas, and Klamath score high on both demographic fragility and public-goods viability risk.
Jefferson, Polk, Malheur, Marion, Umatilla, Linn, and Lake show elevated public-goods viability risk even where demographic fragility varies.
Use the screen as an early-warning overlay for housing, infrastructure, technical assistance, and Opportunity Zone 2.0 targeting decisions.
Hover for the fiscal-capacity profile. Click a county to load its full merged profile in the details panel.
Modeled movement
This 20-second animation shows a modeled path from 2005 to 2025, with one second representing one year. The axes remain fixed and the 2025 endpoints match the current merged dataset. The path lines are included to make the direction of movement easier to see.
Note: this is an exploratory modeled path, not an official annual reconstruction. Annual Business Oregon distress-index values were not available for every year, so intermediate movement is smoothed from available population, aging, tract-change, and final 2025 endpoint indicators.
About this screen
This site documents an exploratory effort to broaden how Oregon communities think about socioeconomic risk. Business Oregon's distressed-area model is a useful economic signal, but it does not directly capture slow-moving population decline, aging, tract-level weakness, housing-market stress, or rural service-risk indicators. This screen is designed to make those mismatches easier to see and discuss.
Practitioners can download the working county dataset used in this screen. The file is provided for review and replication, not as an official state classification or final research product.